We have a map of municipalities.
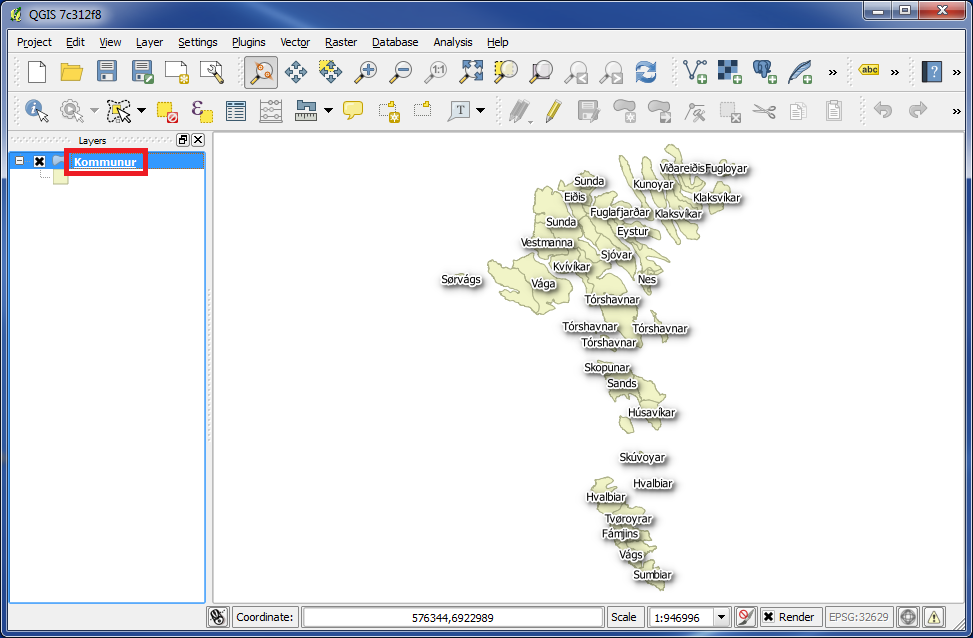
In the left panel double click on the layer, and the box "Layer Properties" appears.
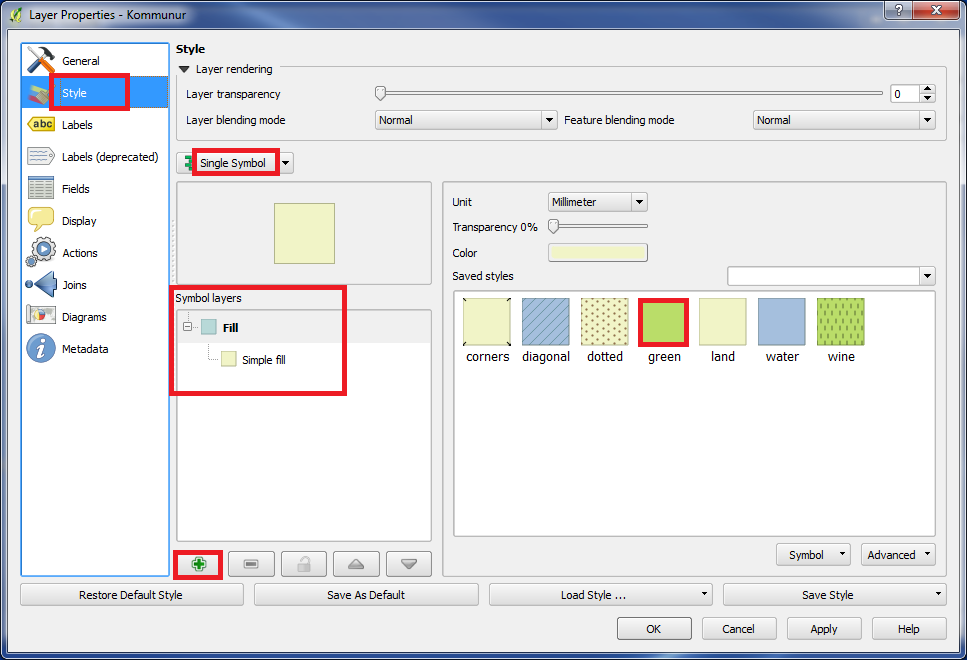
In the left panel choose "Style".
Choose "Single Symbol". (see the picture above)
Choose the green color. See the picture above.
As we see under "Symbol layers", there is 1 layer created of "Symbol". This is of the type "Simple fill", which is the color of all the shapes.
You can create as many "Symbol layers" as you want.
We will do one more "Symbol layer". Click on "+" at the bottom.
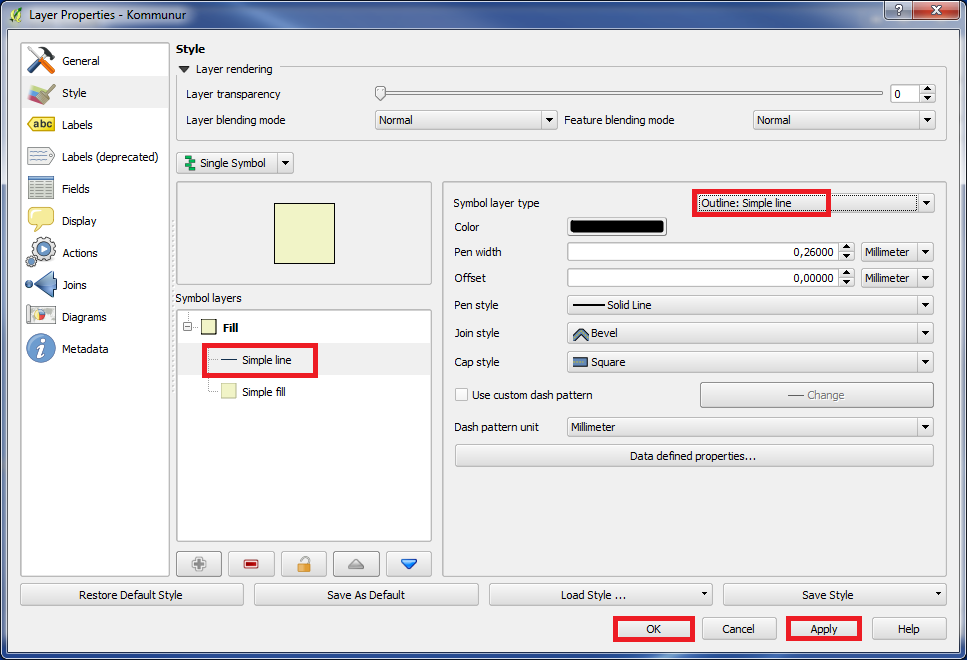
We now got a new "Symbol layer".
Please make sure that you are placed on the new layer, then choose "Outline: Simple line" under "Symbol layer type".
Click on "Apply" and "OK".
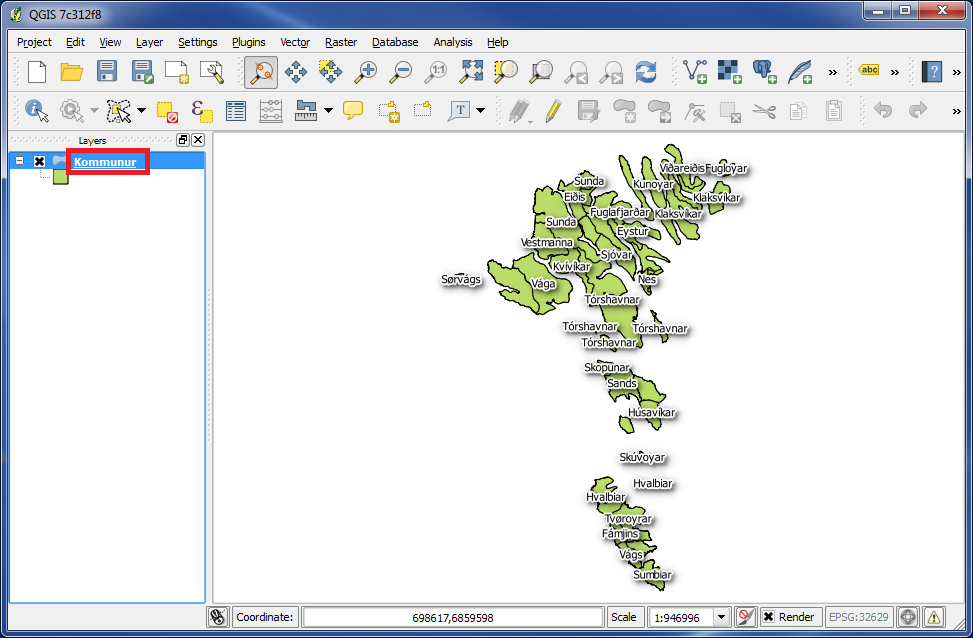
The color of the municipality map changed and became green. Also a black border appears around every municipality area.
In the left panel double click on the layer again, and the box "Layer Properties" appears.
In the left panel click on "Style".
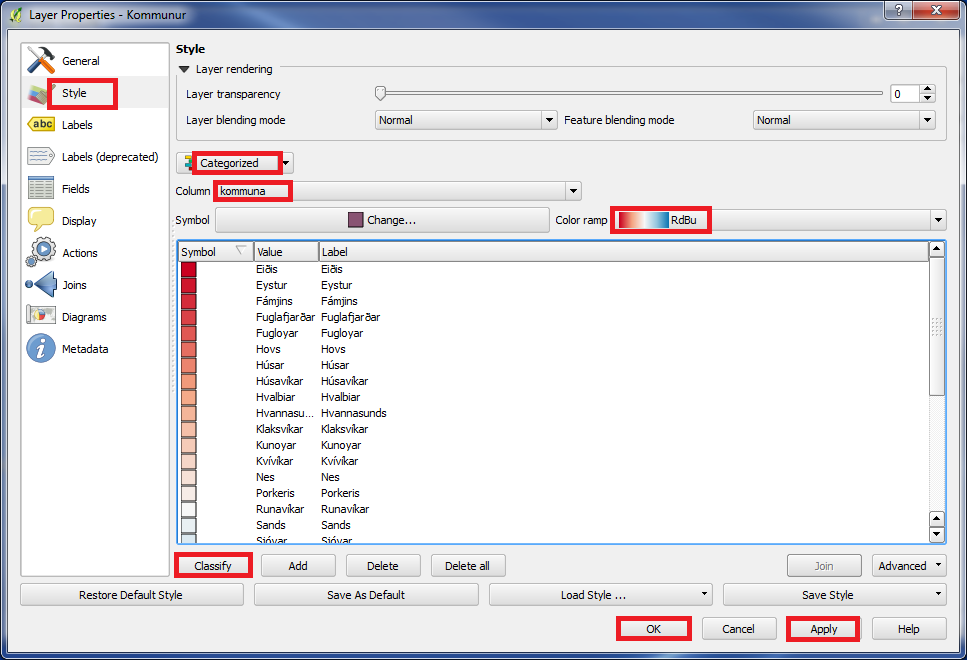
Choose "Categorized". (see the picture above)
Under "column" we can choose a column in the database table, which we want to group by. In our example we choose "kommuna".
Choose a "Color ramp" by your own choice.
Click on "Classify".
Click on "Apply" and "OK".
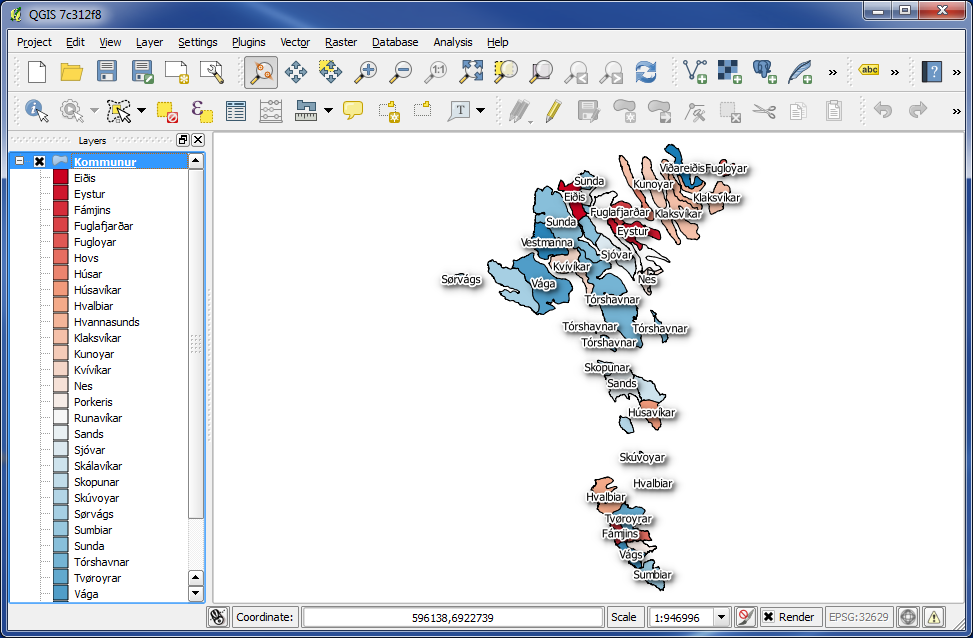
And now every municipality got their special color on the map.
You are welcome to write comments below. If you have any questions, please post in the forum.