Lets say we created some points, which we named "Poi" (Points of Interest).
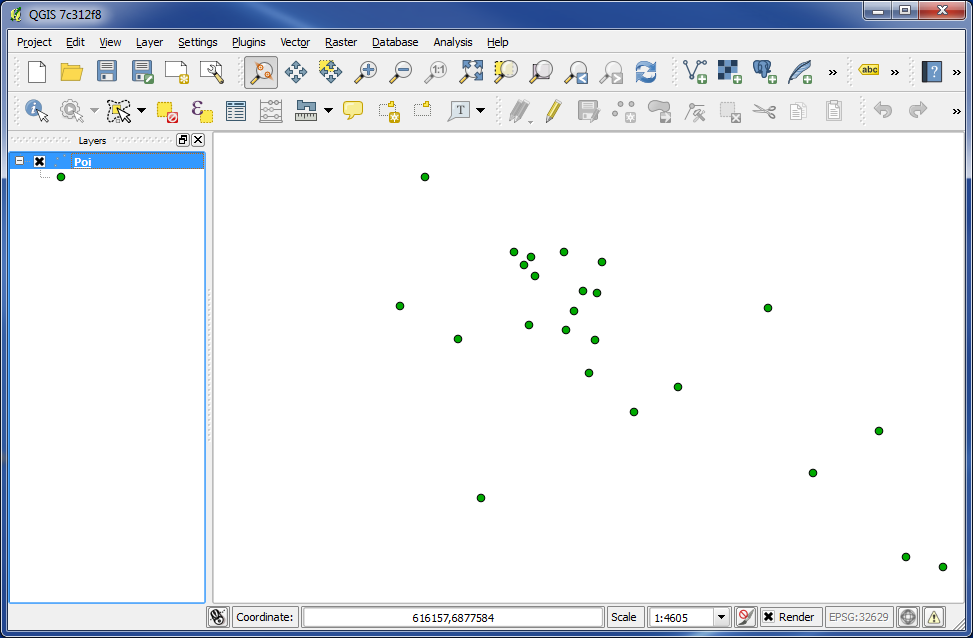
We now want to change colors etc. of this layer.
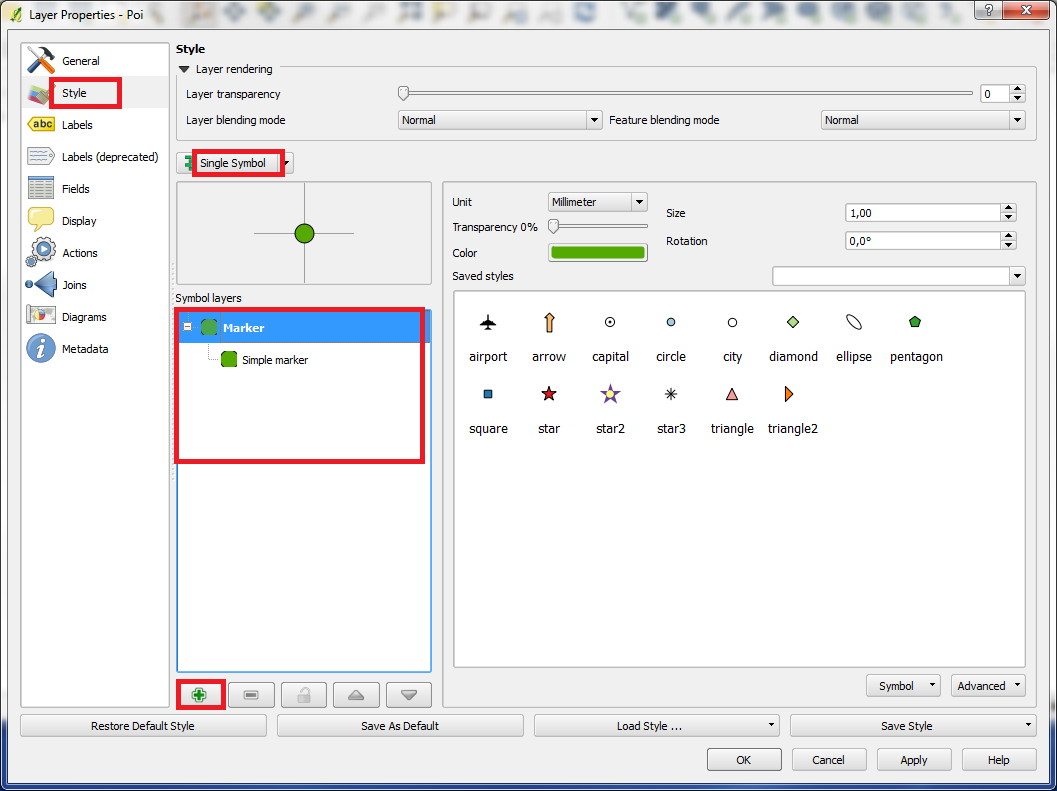
Double click on the layer "Poi" and the box "Layer Properties" appears.
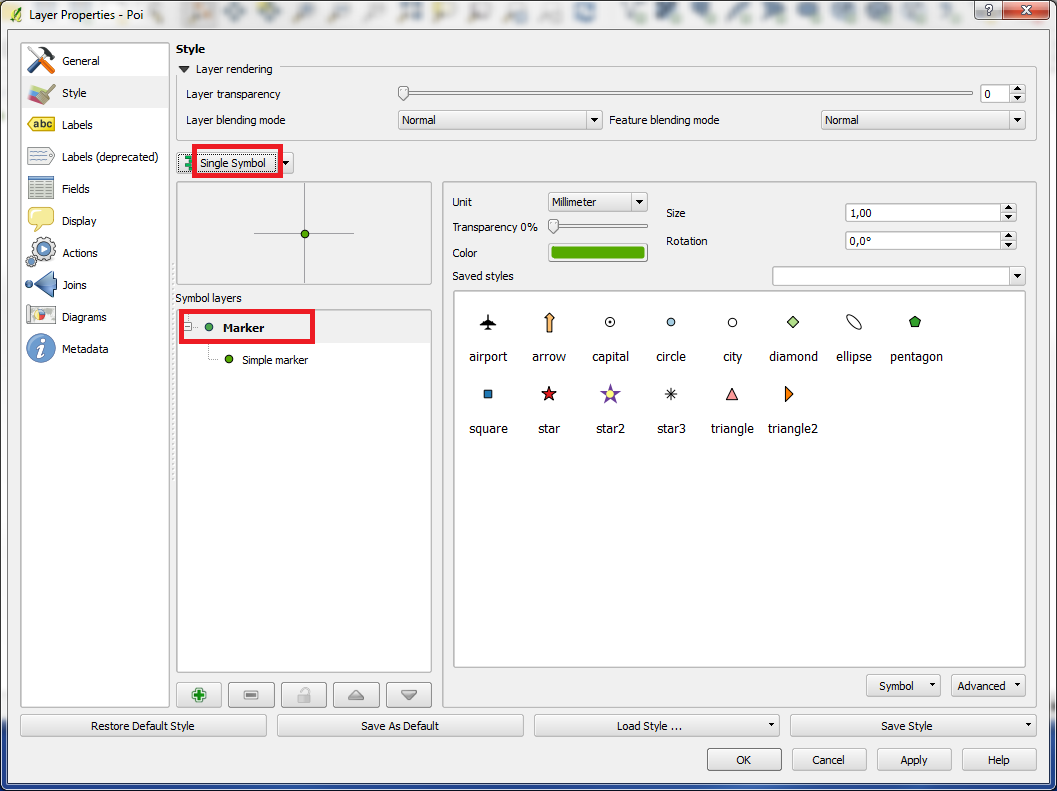
In the left panel click on "Style".
Choose "Single Symbol". (see the picture above)
Click on "Marker" under "Symbol layers".
In this page you can change color, size etc., and you can also choose between some simple icons.
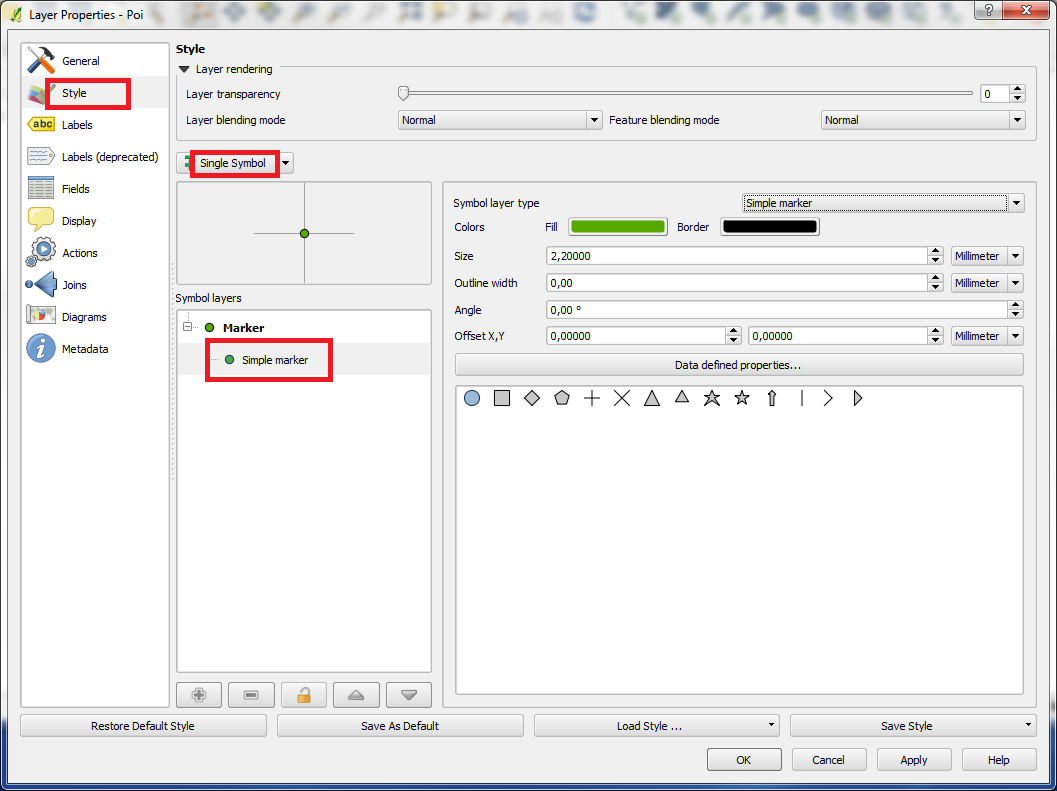
Click on "Simple marker" under "Symbol layers".
At first look this page doesnt look much different from the first one.
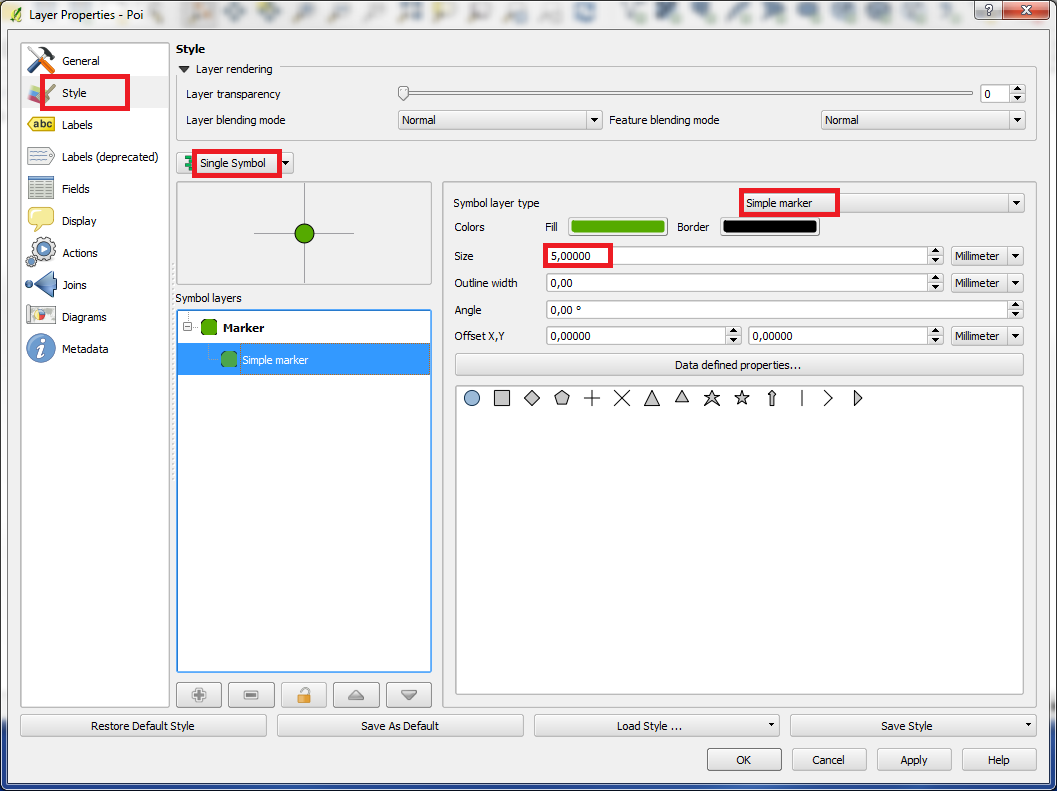
Please notice "Symbol layer type". This is now set to "Simple marker", but there are multiple choices.
We will make the green point bigger by edit "size" to 5,0.
Please notice "Symbol layers".
Just as we can have many layers of maps, we can also have many layers of "Styles".
In this moment we only have 1 layer, which is a green point. Or we can call it a green dot, which has a width of 5 millimeters.
We will now add another layer, so that we have 2 layers.
We can create a new "Symbol layer" by clicking on "+" at the bottom.
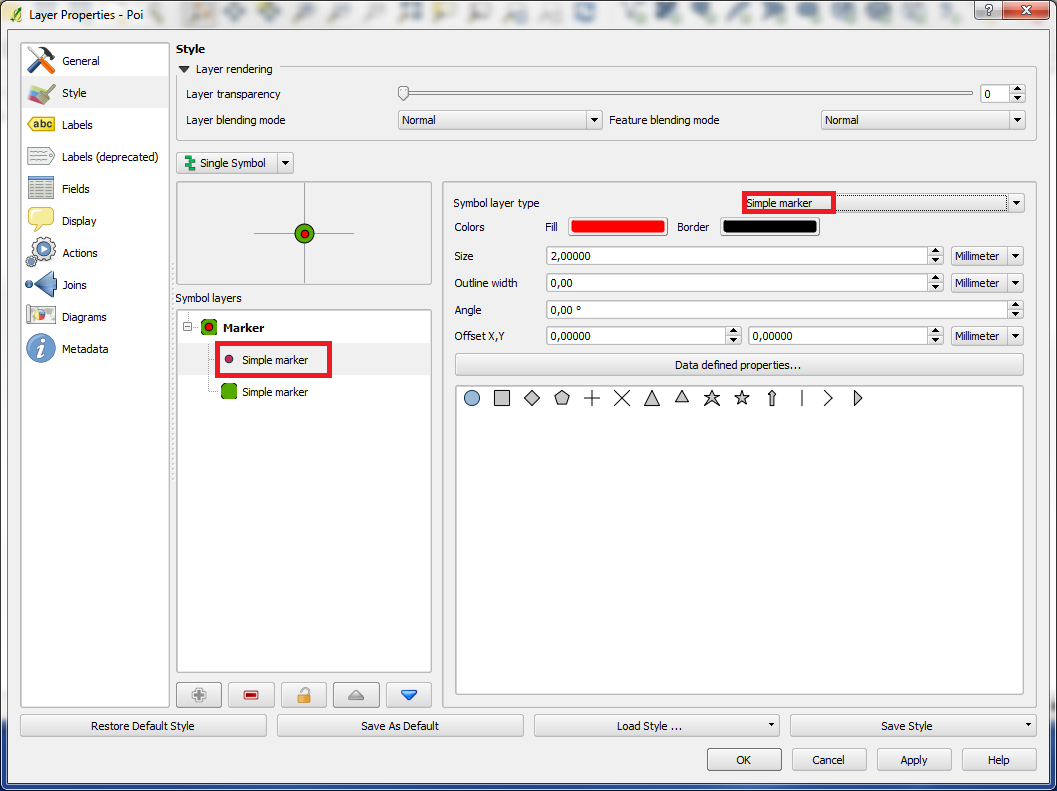
Now we see, that we have 2 layers (or 2 symbols). Both are of the type "Simple marker".
The new layer did become a red dot, and because it is above the green dot in the list, it will appear in front of the green dot in the graphics.
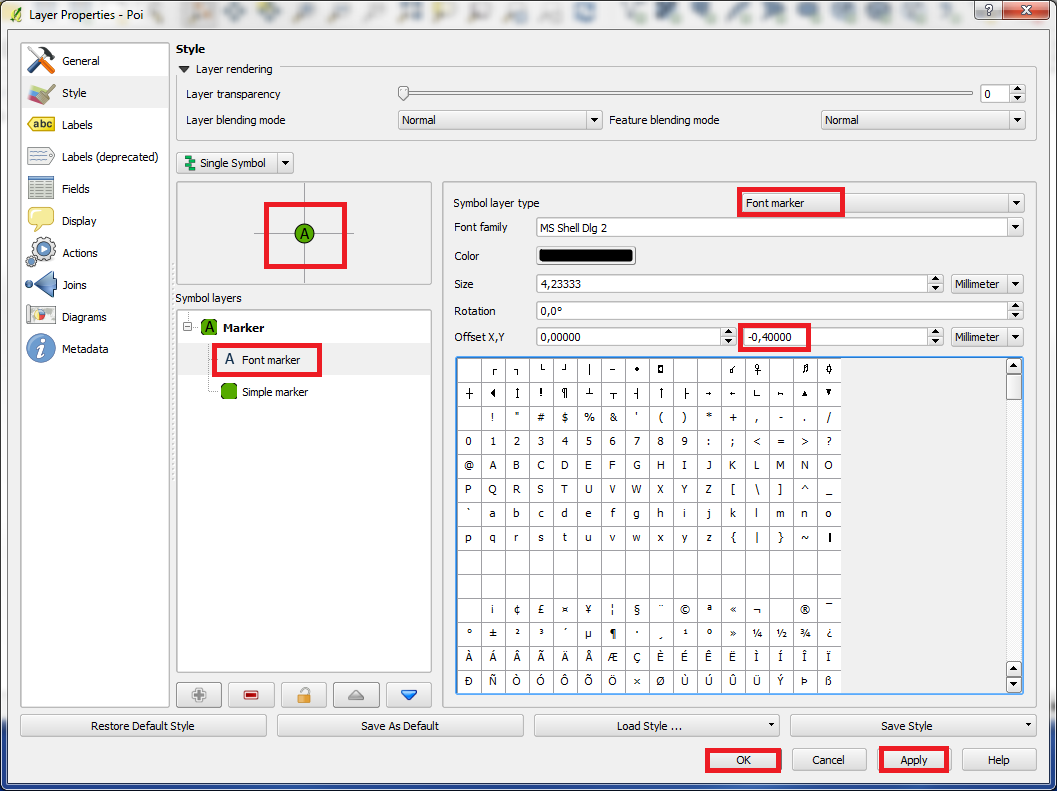
We now change "Symbol layer type" for the red dot to "Font Marker".
Now we can choose letters, numbers and other signs/characters. We choose an "A", and by using "Offset X,Y" we place the "A" nicely inside of the green dot.
We now see that we have 2 "Symbol layers", one of the type "Font marker" and one of the type "Simple marker".
Click "Apply" and "OK".
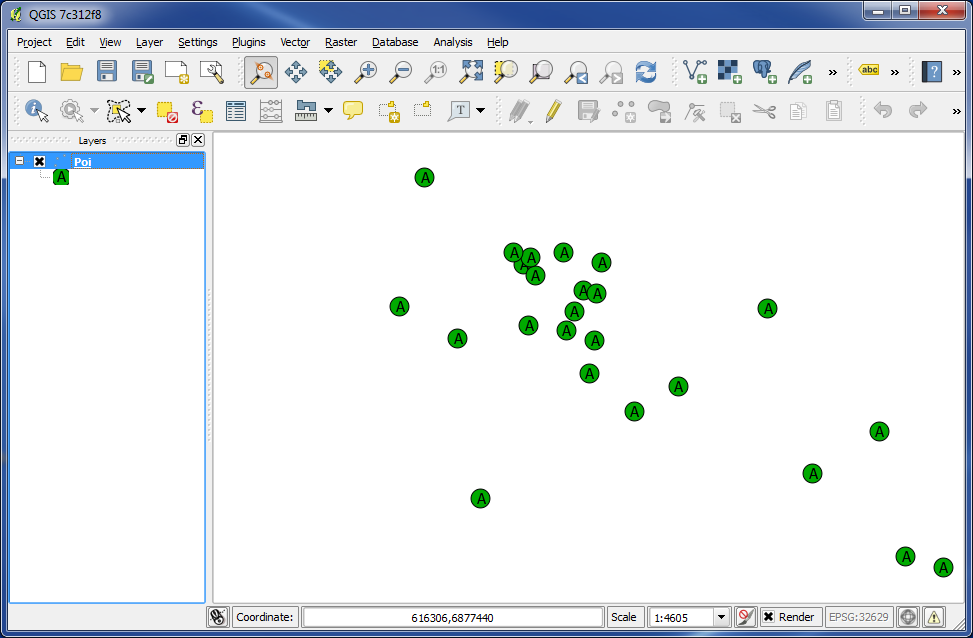
And here is the result.
We will then show another way to create "Styles".
In the left panel double click on the layer, and the box "Layer Properties" appears.
In the left panel click on "Style".
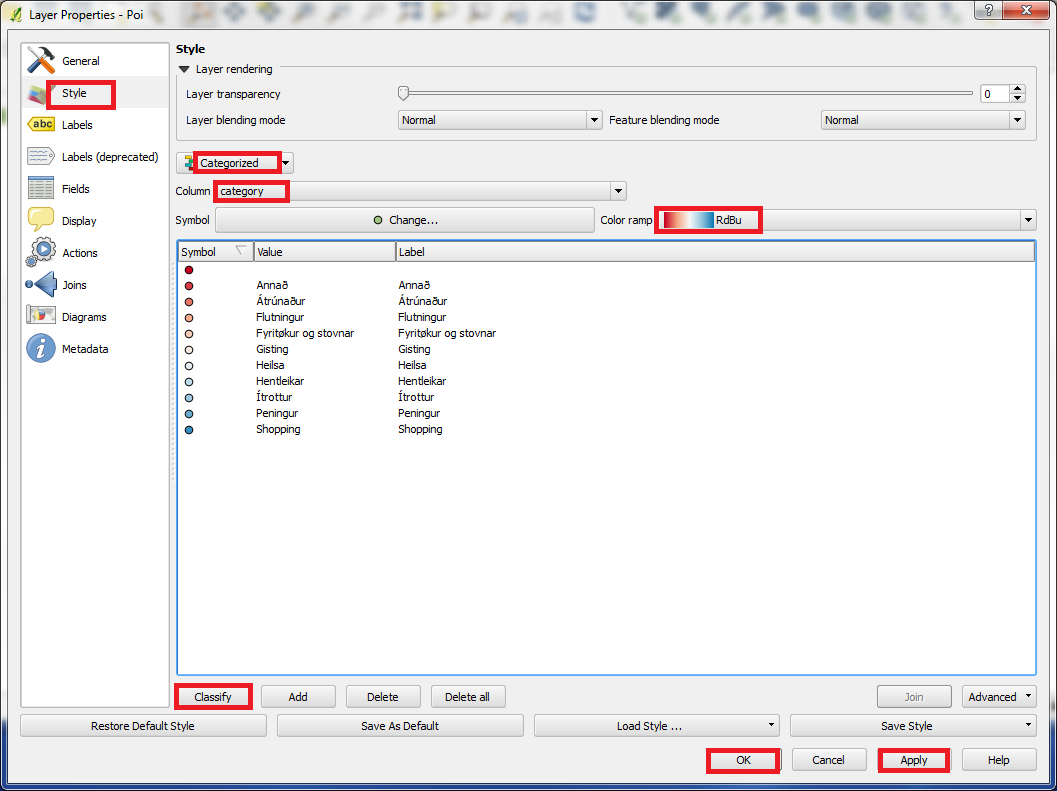
Choose "Categorized" at the top. (see the picture above)
In "Column" you can choose a column in the database table. The data will be categorized by this column. In our example we choose "category".
Choose a "Color ramp" by your own choice.
Click on "Classify".
Click on "Apply" and "OK".
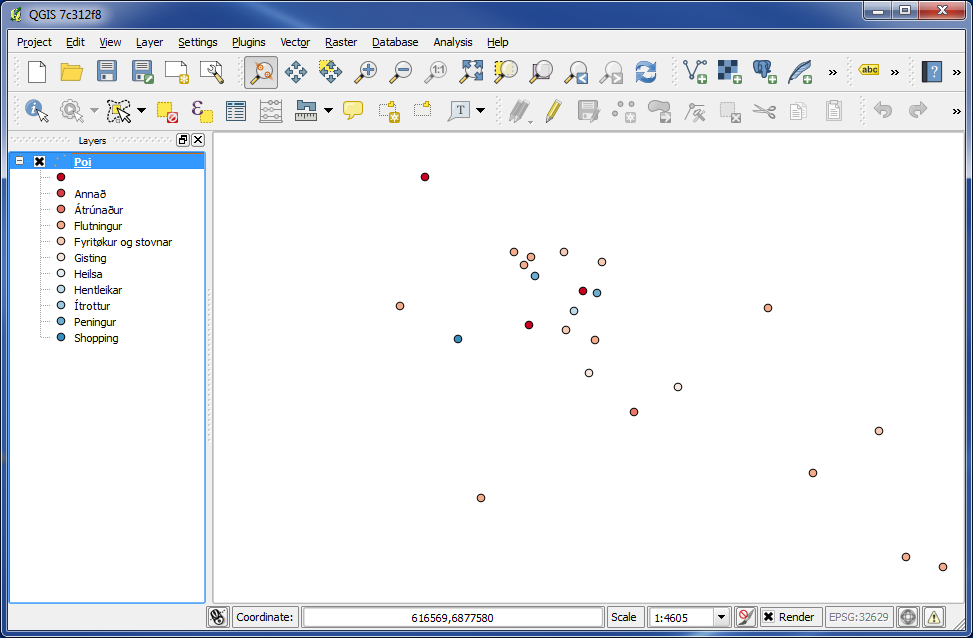
And here is the result. The points get their color dependent of which type of "Poi" they are.
You are welcome to write comments below. If you have any questions, please post in the forum.